South East Asia Energy Value Chain Wallmap
Summary
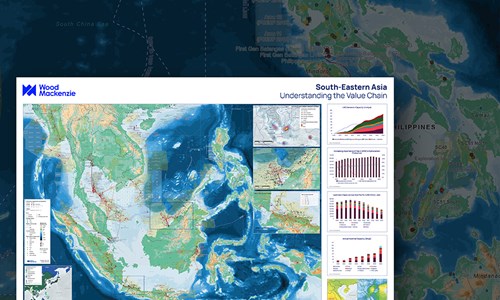
Our detailed wallmap of South East Asia showing the latest information about the oil & gas industry, carbon capture, hydrogen and power infrastructure in the region.
The map shows developed and undeveloped oil and gas fields, active CBM and conventional blocks, oil and gas pipelines, refineries, LNG terminals and LNG country supply/demand statuses, power plants by energy source, carbon capture projects together with field emissions and hydrogen projects within South East Asia.
In addition, the map also includes charts detailing the following:
- LNG Demand v Capacity (mmtpa)
- Increasing Importance of Gas in APAC’s Hydrocarbon Production
- Upstream Capex across Asia Pacific (US$ million, real)
- Annual Nominal Capacity (Mtpa)
This map is an invaluable reference for anyone interested in the South East Asia energy sector. Wallmaps bought online will be couriered to you.
Why buy a wallmap?
Our maps bring together trusted data and research from across the globe. And we have a team of analysts and researchers committed to ensuring the continued accuracy and consistency of data across the entire collection. With a Wood Mackenzie map, you can:
- Gain an instant visual appreciation of multiple assets and markets across global locations.
- Use them as reference documents in group discussions
- Get a single, reliable overview
What will you receive?
- Printed to make a big and lasting impression, each map is 84cm x 120cm or 33 inches x 46 3/4 inches on high quality paper
- Couriered to you when purchased online
- Delivered in a tough cardboard tube to ensure maps reach you in pristine condition
Other reports you may be interested in
Cepu
The prolific Cepu block contains main oil producer Banyu Urip, Jambaran-Tiung Biru sour gas development, and more potential developments.
$5,750Global Upstream Update: our favourite slides and topics – May 2024
Key themes: deepwater, decommissioning, gas spend and rising costs across the sector.
$1,350Battle for the future 2023: Asia Pacific power and renewables competitiveness overview
Analysis and outlook for APAC power technology and generation cost trends, including LCOE data and assumptions covering 26 technologies.
$5,990


